






Business intelligence that answers the question you actually have.
When two reports give two different answers, which one do you take to the board? We bring your data into one place and agree, in writing, what every number means. Then we build the dashboards your leadership actually opens. Most take 4 to 10 weeks.
The first one sits underneath all the others. Skip it and everything above it wobbles.
Every system loaded into one place, transformed into one model, with every metric defined once and tested. The foundation the rest sits on.
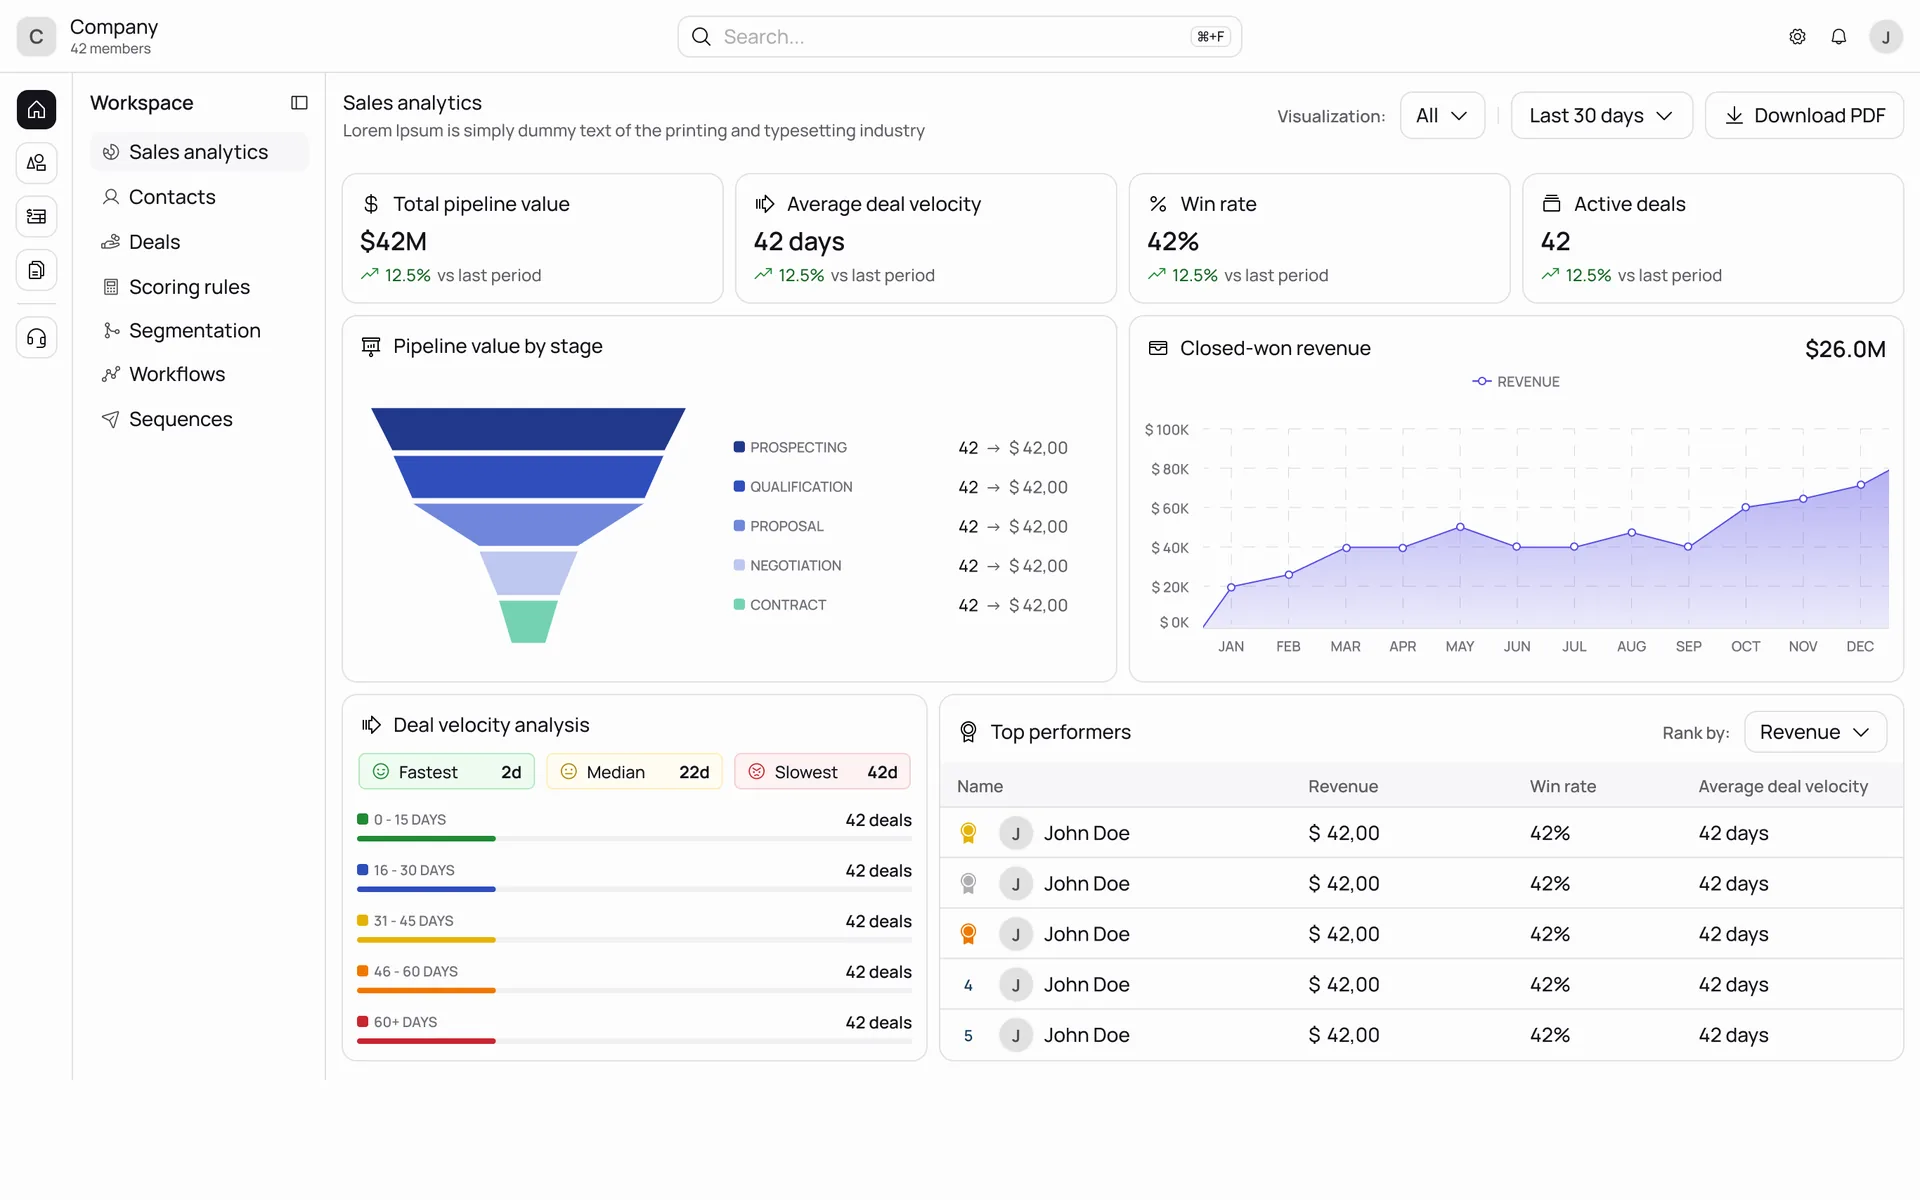
In your own database, with tested definitionsRevenue, margin, utilization, pipeline, on-time. Drill down to the row. The Monday meeting stops arguing about whose number is right.
On Metabase or Power BIYour customers see their own numbers inside your portal: volumes, SLAs, spend. Access rules sit in the data itself, so they only ever see theirs.
Inside your web applicationThe board pack, the weekly numbers and the client report generated on a schedule instead of assembled from six exports on a Thursday night.
By PDF, email or SlackCash, demand, capacity. Simple models you can explain to the board, before anything clever. Revisited monthly against actuals.
Built on your data modelProduct Discovery produces the list of questions, the definition of each metric and the systems that hold the data. The fee comes off a build that starts within 30 days of the workshop.
See Product DiscoveryBuy the BI tool. Build the model under it.
If all your data lives in one clean system, a BI tool on its own will do, and we’ll say so.
Choose it when one system holds all the data, the fields mean what they say, and one analyst owns the dashboards. Connect the tool and go.
Watch for: The second system. Two definitions of revenue, joined in the dashboard tool, by whoever built that dashboard, undocumented.
Choose it when a small team, one source, a monthly cadence, and someone who enjoys maintaining it. Honest and cheap for a while.
Watch for: Version 7 (2), the vlookup that broke in March, and the person who knows how it works taking time off.
Choose it when three or more systems, numbers that leadership disagrees on, reporting to customers or a board, and 50 or more people who depend on the answer.
What you get: A price agreed before we start, a tested model with every metric defined once, dashboards on the tool you already pay for, and training for the two people who will own it.
The first dashboard in week four. The Monday argument gone by week ten.
An example 12-week build: the numbers agreed first, then the dashboards and automatic reports on top.
- Week 0 Product Discovery
The questions leadership asks, written down. Every metric defined and its owner named. Every source system listed. You get a price we’ll hold and a sprint plan.
- Weeks 1 to 2 · Sprint 1 Foundations
Warehouse and code repository in your name. The first two sources loaded, the first three metrics modeled and tested. Demo one: one number, agreed by finance and operations.
- Weeks 3 to 8 · Sprints 2 to 4 The model and first dashboards
Remaining sources loaded, the core model built with tests, the management dashboard live on your BI tool. Your finance lead reviews each definition each sprint.
- Weeks 9 to 10 · Sprint 5 Pilot with leadership
The Monday meeting runs off the dashboard for two weeks alongside the old pack. Automated reports and per-person data access land while they use it.
- Weeks 11 to 12 · Sprint 6 Handover and training
Old pack retired, documentation generated from the model, two of your people trained to add a metric. Security review with IT, every credential handed over.
Five parts. The middle one decides whether you trust the number.
Your first dashboard arrives in week four, built on a model that’ll still be right in year three.
Forwarding this to your IT lead? Send them the one-page security summary
ERP, CRM, finance, ops systems, spreadsheets while they last
Sources
Each system loaded as it is, unchanged, into a raw layer. Nightly for most, streaming for the operational ones. The spreadsheet that runs a department is a source too, until it’s retired.
Your account, your region
Warehouse
One database for everything. Postgres for most companies your size; BigQuery when the volume or the Google stack calls for it. Raw, staged and final layers kept separate.
dbt keeps each metric in code: tested, documented, versioned in Git
Model
Where “active customer”, “gross margin” and “on time” are defined, once, in code, with tests that fail when the data breaks. Every metric has a definition page and an owner.
The tool you already pay for, or a custom dashboard
Presentation
Dashboards on top of the model, never directly on the source systems. Metabase when you want simple and open, Power BI when you’re a Microsoft shop, a custom Next.js screen when the tool can’t show it the way you need.
Row-level security decides who sees which rows
Identity and access
Managers see their region, customers see their own account, finance sees everything. Enforced in the model, not in the dashboard, so it holds whatever tool sits on top.
What we’d turn down.
A studio that builds everything isn’t telling you the truth about something.
- Dashboards on data nobody owns If no one in the company can say what a metric means, a dashboard will only make the disagreement prettier. We start with the definitions or not at all.
- Spreadsheet macros If the ask is to keep the workbook alive, a specialist will do it faster. If the ask is to retire it, that’s us.
- Data science without a question Models and machine learning come after a clean model and a clear question. We’ll say so in Product Discovery.
Questions buyers ask first.
We already have Power BI. Do we need anything else?
You need a model under it. Power BI pointed at six systems with the joins built in each report is how the numbers stopped agreeing. We build the warehouse and the data model under it; Power BI stays your front end.
Do we really need a warehouse?
If you have one system, no. If you have three and want one truth, yes, and it’s a database in your account, not a platform. Running it is tens of dollars a month.
How fresh is the data?
Per source. Operational systems every fifteen minutes or streamed; finance nightly. Every dashboard shows when its data was last loaded.
Who maintains the model after launch?
Two of your people, trained in the last sprint, with documentation generated from the code. Or a retainer from us. Most clients do both.
Can our customers see their own numbers?
Yes. Access rules sit in the data model (your IT lead will call this row-level security), so a customer signed in to your portal sees only their own numbers, whatever tool sits on top. This is often the most valuable dashboard of all.
What about Excel?
Every dashboard exports. Finance keeps Excel for what Excel is good at; it stops being the database.